マイコン宇宙講座-人工衛星軌道追跡
夜空にはたくさんの人工衛星が飛び交っています。明るいものから暗いものまで様々です。地上から人工衛星を追跡するのは大変です。人工衛星と言えるかどうかはわかりませんが、宇宙ステーションISSを追跡して写真を取られた方は結構おられますが、それ以外の人工衛星については見かけません。移動速度が速すぎるということも挙げられますし、なにより非常に暗いのが追跡を困難にしているのかもしれません。
現在、人工衛星の位置の把握は打ち上げた米国やソ連、欧州などで追跡は続けられていますが、一般の人には全くわからないのが現状でしょう。ただし、別に専門家でなくとも人工衛星がどこにいて、どの方向に移動しているかは、ステラナビゲーターやSkySafariなどの天文ソフトによって確認することができます。また、Webでも地図上の位置を表示してくれるサイトもあり、便利になったものです。
マイコン宇宙講座の人工衛星追跡は、そういったソフトウェアとは少し異なり、打ち上げた人工衛星の軌道とマップ上の移動軌跡を表示してくれるものです。指定した日付と時刻に対して、どの位置に見えるかというものではありません。ただ、自分が打ち上げた人工衛星がどんな軌道を描いて、地球上をどういった軌跡を描くかを見るものは楽しいものです。
サブルーチン print_elements
※サブルーチンはlib.pyに記述してください。
# 軌道要素の表示
def print_elements(td, pe, nd, ic, ec, q, ep, T, K):
    jd = td
    yy, mm, dd = jdate(jd, T)
    a = q / (1.0 - ec)
    pd = 0.00995198 * pow(a, 1.5)
    no = 2.0 * math.pi * 86400.0 / pd
    mo = no * (td - ep)
    r1 = a / 6378.16
    ww = 0.174 * (2.0 - 2.5 * math.sin(ic)**2) / pow(r1, 3.5)
    nn = -0.174 * math.cos(ic) / pow(r1, 3.5)
    uu = no + ww
    r3 = 2.0 * math.pi * 86400.0 / uu
    if abs(mo * K[3]) > 0.1:
        print('    Epoch =  %4d  %2d  %6.3f ET   Mo = %9.3f' % (yy, mm, dd, mo))
    print('     T    =  %4d  %2d  %6.3f ET' % (yy, mm, dd))
    print('     Peri.=   %7.3f               e =     %7.5f' % (pe * K[3], ec))
    print('     Node =   %7.3f (Date)        a =%9.2f (Km)' % (nd * K[3], a))
    print('     Inc. =   %7.3f               n = %12.6f' % (ic * K[3], no * K[3]))
    print('        q =%9.2f (Km)           P = %8.2f 分' % (q, pd / 60.0))
    print('       ww =  %7.2f      Node Period = %8.2f 分' % (ww * K[3], r3 / 60.0))
    print('       nn =  %7.2f' % (nn * K[3]))
    print('\n')

    return a, pe, no, pd, ww, nn
メインルーチン m45.py
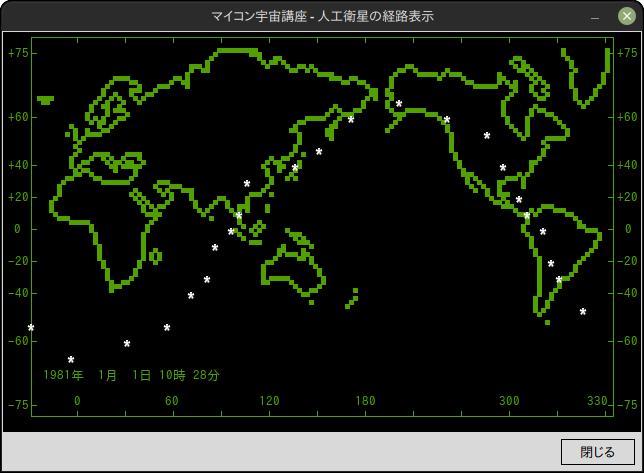
打ち上げデータを入力すると、ターミナルに人工衛星の軌道要素を表示し、打ち上げた人工衛星の地球上の周回軌道をグラフィックで表示します。ウィンドウを閉じると、人工衛星の軌跡をマップ上に表示します。
# m45.py
# マイコン宇宙講座
# 4-5 人工衛星の軌道と経路追跡プログラム
from PIL import Image, ImageDraw, ImageFont
from tkinter.constants import SOLID
import tkinter as tk
import csv
import glob
import math
import lib
# 世界地図のフレーム
def drawing_frame(map_color, fonts, draw):
latitude = [
[16, '+75'],
[80, '+60'],
[128, '+40'],
[160, '+20'],
[192, '0'],
[224, '-20'],
[256, '-40'],
[304, '-60'],
[368, '-75']
]
# フレーム
draw.rectangle((28, 5, 610, 384), outline=map_color, width=1)
# 緯度
for i in range(9):
y = latitude[i][0]
la = latitude[i][1]
drawing_latitude(y, la, fonts, draw)
# 経度
for lg in range(74, 610, 48):
draw.line((lg, 5, lg, 10), fill=map_color, width=1)
draw.line((lg, 379, lg, 384), fill=map_color, width=1)
draw.text((71, 362), '0', font=fonts, fill=map_color)
draw.text((162, 362), '60', font=fonts, fill=map_color)
draw.text((256, 362), '120', font=fonts, fill=map_color)
draw.text((352, 362), '180', font=fonts, fill=map_color)
draw.text((496, 362), '300', font=fonts, fill=map_color)
draw.text((584, 362), '330', font=fonts, fill=map_color)
# 緯度を描く
def drawing_latitude(y, la, fonts, draw):
draw.line((28, y+5, 33, y + 5), fill=map_color, width=1)
draw.line((605, y+5, 610, y + 5), fill=map_color, width=1)
if la == '0':
draw.text((11, y - 7 +5), la, font=fonts, fill=map_color)
draw.text((622, y - 7 + 5), la, font=fonts, fill=map_color)
else:
draw.text((5, y - 7 + 5), la, font=fonts, fill=map_color)
draw.text((614, y - 7 + 5), la, font=fonts, fill=map_color)
# 世界地図を描く
def drawing_map(map_color, draw):
# 地図データの読み込み
files = glob.glob('./map/*.csv')
for file_name in files:
fp = open(file_name, 'r')
reader = csv.reader(fp)
for data in reader:
x = int(data[0]) * 4
y = int(data[1]) * 4 + 18
draw.rectangle((x - 2, y - 2, x + 2, y + 2), fill=map_color)
fp.close()
# メイン
u = [0, 0, 0, 0]
# フォント名は実行環境に合わせて変更すること
fonts1 = ImageFont.truetype('TakaoGothic.ttf', 13)
fonts2 = ImageFont.truetype('Ubuntu-B.ttf', 16)
fonts3 = ImageFont.truetype('Ubuntu-B.ttf', 24)
# カラーパレット
map_color = (80, 160, 0)
earth_color = (0, 90, 205)
moon_color = (255, 240, 90)
orbit_color = (255, 255, 255)
lg = 139.745 / lib.K[3]
la = 35.654 / lib.K[3]
obs = 'Tokyo'
print()
std = input('打ち上げ日と時刻 ? ')
dy, dt = std.split(',')
dy = float(dy)
dt = float(dt)
jd, yy, mm, dd, hh, ms, ss = lib.mjd(dy, dt)
jd1 = jd
jd2 = jd
h = input('打ち出し高度(Km) ? ')
h = float(h)
while True:
vo = input('打ち出し速度(Km/sec) ? ')
vo = float(vo)
r = 6378.16 + h
a = 2.0 / r - pow((vo / 631.35), 2)
a = 1.0 / a
ec = 1.0 - r / a
if a < 0 and ec < 0:
print('\n\nERROR: この速度では打ち上げられません!\n')
else:
break
# end while
r1 = la
r2 = h * 1000.0
r3 = lib.geocentric_latitude(r1, r2)
la = r3
while True:
ic = input('軌道傾斜角 ? ')
ic = float(ic)
ic = ic / lib.K[3]
if abs(ic) < abs(la) or abs(ic) > math.pi - abs(la):
print('\n\nERROR: この角度では打ち上げられません!\n')
else:
break
# end while
r = 6378.16 + h
q = r
a = 2.0 / r - pow((vo / 631.35), 2)
a = 1.0 / a
ec = 1.0 - q / a
ss = math.sin(la) / math.sin(ic)
cc = math.sqrt(1.0 - ss * ss)
v = math.atan(ss / cc)
if v < 0:
v += math.pi
pe = v
ss = math.sin(v) * math.cos(ic) / math.cos(la)
cc = math.cos(v) / math.cos(la)
tt = lib.quadrant(ss, cc)
l1 = lg - tt
r1 = jd1
r2 = 0
r3 = lib.siderealtime_date(r1, r2)
nd = r3 + l1
if nd < 0:
nd = nd + 2.0 * math.pi
if nd > 2.0 * math.pi:
nd = nd - 2.0 * math.pi
print('\n\n===== SATELLITE ELEMENTS =====\n')
td = jd
ep = td
ic = abs(ic)
a, pe, no, pd, ww, nn = lib.print_elements(td, pe, nd, ic, ec, q, ep, lib.T, lib.K)
# std = input('PRESS ANY KEY ')
# 人工衛星の軌道表示 -----------------------------------------
root = tk.Tk()
root.resizable(False, False)
root.geometry('640x440')
root.title('マイコン宇宙講座 - 人工衛星の軌道表示')
img = Image.new('RGB', (640, 400), (0, 0, 0))
draw = ImageDraw.Draw(img)
canvas = tk.Canvas(root, width=640, height=400, bg='black')
canvas.pack(anchor=tk.NW)
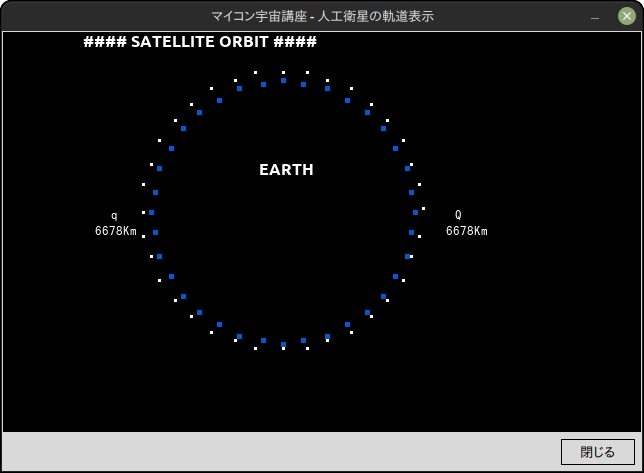
# 人工衛星の軌道のプロット
draw.text((80, 0), '#### SATELLITE ORBIT ####', font=fonts2)
aa = 35.0 / a * 6378.16
for i in range(0, 360, 10):
m = i / lib.K[3]
x = (int(aa * math.cos(m)) + 70) * 4
y = (int(aa * math.sin(m)) + 45) * 4
draw.rectangle((x - 2, y - 2, x + 2, y + 2), fill=earth_color)
draw.text((32 * 8, 8 * 16), 'EARTH', font=fonts2)
qq = a * (1.0 + ec)
if qq > 350000:
aa = aa * 380000.0 / 6378.16
x = int((aa / 2 + 35) - 5) * 8
draw.text((x, 11 * 16), 'Moon ○', font=fonts1, fill=moon_color)
a1 = 35
b1 = a1 * math.sqrt(1.0 - ec * ec)
for m in range(0, 360, 10):
mo = m / lib.K[3]
ss, cc, ff = lib.kepler(mo, ec)
x = -(a1 * ff)
y = -(b1 * ss)
x = int(x + 70) * 4
y = int(y + 45) * 4
# 2ピクセルの円
draw.ellipse((x - 1, y - 1, x + 1, y + 1), fill=orbit_color)
# 近日点および遠日点の距離を表示
a1 = a1 / 2.0
q1 = a1 * (1.0 - ec)
q2 = a1 * (1.0 + ec)
q1_str = '%4dKm' % (q)
q2_str = '%5dKm' % (qq)
draw.text(((35 - 4 - q1) * 8, 11 * 16), 'q', font=fonts1)
draw.text(((35 - 6 - q1) * 8, 12 * 16), q1_str, font=fonts1)
draw.text(((35 + 4 + q2) * 8, 11 * 16), 'Q', font=fonts1)
draw.text(((35 + 2 + q2) * 8, 12 * 16), q2_str, font=fonts1)
# 描画した画像を保存
img.save('./images/satellite_orbit.png')
# 画像の表示
photo = tk.PhotoImage(file='./images/satellite_orbit.png', master=root)
canvas.create_image(1, 1, image=photo, anchor=tk.NW)
button = tk.Button(root, text='閉じる', width=6, relief=SOLID, cursor='hand1', command=root.destroy)
button.place(x=558, y=407)
root.mainloop()
# std = input('PRESS ANY KEY ')
# 人工衛星の経路表示 -----------------------------------------
root = tk.Tk()
root.resizable(False, False)
root.geometry('640x440')
root.title('マイコン宇宙講座 - 人工衛星の経路表示')
img = Image.new('RGB', (640, 400), (0, 0, 0))
draw = ImageDraw.Draw(img)
canvas = tk.Canvas(root, width=640, height=400, bg='black')
canvas.pack(anchor=tk.NW)
# フレーム描画
drawing_frame(map_color, fonts1, draw)
# 離心率が0.7より小さいときのみ表示
if ec < 0.7:
# 地図プロット
drawing_map(map_color, draw)
while True:
r1 = jd1
r2 = 0
r3 = lib.siderealtime_date(r1, r2)
qg = r3
mo = no * (jd1 - td)
mo = mo / (2.0 * math.pi)
mo = 2.0 * math.pi * (mo - int(mo))
ss, cc, ff = lib.kepler(mo, ec)
b = a * math.sqrt(1.0 - ec * ec)
ss = b * ss
cc = a * ff
tt = lib.quadrant(ss, cc)
v = tt
pe = pe + ww * (jd1 - td)
nd = nd + nn * (jd1 - td)
v = pe + v
u[1] = math.cos(v)
u[2] = math.sin(v) * math.cos(ic)
u[3] = math.sin(v) * math.sin(ic)
ss = u[2]
cc = u[1]
tt = lib.quadrant(ss, cc)
lm = tt + nd - qg
if lm < 0:
lm = lm + 2.0 * math.pi
lm = lm / (2.0 * math.pi)
lm = 2.0 * math.pi * (lm - int(lm))
ss = u[3]
cc = u[1] / math.cos(tt)
fi = math.atan(ss / cc)
x = 6 + lib.K[3] * (lm + 0.523599) * 0.4
if x > 150:
x = x - 150 + 6
fo = abs(fi)
y = 21.7007 * math.log(math.tan(math.pi / 4.0 + fo / 2.0))
if fi > 0:
y = -y
if fi * lib.K[3] > 73:
y = -44
if fi * lib.K[3] < -73:
y = 44
x = int(x / 2)
y = int(12.5 + y / 4)
draw.text((x * 8, y * 16), '*', font=fonts2)
jd = jd1 + 0.375
yy, mm, dd = lib.jdate(jd, lib.T)
dh = int(dd)
hh = 24.0 * (dd - dh)
dd = dh
ms = 60.0 * (hh - int(hh))
hh = int(hh)
jd1 = 4.0 / 1440.0 + jd1
if jd1 >= jd2 + pd / 86400.0:
break
date_str = '%4d年 %2d月 %2d日 %2d時 %2d分' % (yy, mm, dd, hh, ms)
draw.text((5 * 8, 21 * 16), date_str, font=fonts1, fill=map_color)
# 描画した画像を保存
img.save('./images/satellite_course.png')
# 画像の表示
photo = tk.PhotoImage(file='./images/satellite_course.png', master=root)
canvas.create_image(1, 1, image=photo, anchor=tk.NW)
else:
draw.text((230, 160), 'SIGNAL LOST!', font=fonts3, fill=map_color)
draw.text((100, 190), 'The signal was lost because the eccentricity exceeded 0.7.', font=fonts2, fill=map_color)
# 描画した画像を保存
img.save('./images/satellite_course.png')
# 画像の表示
photo = tk.PhotoImage(file='./images/satellite_course.png', master=root)
canvas.create_image(1, 1, image=photo, anchor=tk.NW)
button = tk.Button(root, text='閉じる', width=6, relief=SOLID, cursor='hand1', command=root.destroy)
button.place(x=558, y=407)
root.mainloop()例題 1981年1月1日 9時00分00秒に以下の打ち上げデータで打ち上げた人工衛星の軌道と軌跡を確認してみよう。
打ち上げ高度: 300Km
打ち上げ速度: 7.726Km/秒
軌道傾斜角: 63度
打ち上げ日と時刻 ? 19810101,090000
打ち出し高度(Km) ? 300
打ち出し速度(Km/sec) ? 7.726
軌道傾斜角 ? 63


===== SATELLITE ELEMENTS =====

     T    =  1981   1   1.000 ET
     Peri.=    40.650               e =     0.00006
     Node =   219.009 (Date)        a =  6678.56 (Km)
     Inc. =    63.000               n =  5726.413824
        q =  6678.16 (Km)           P =    90.53 分
       ww =     0.13      Node Period =    90.53 分
       nn =    -3.85