マイコン宇宙講座-大圏コース
今回は、世界地図をディスプレイ上に描き、2つ地点を移動する際の大圏コースをプロットしていきます。天文計算とはあまり関係ありませんが、作成した世界地図は人工衛星追跡でも使用します。使用する世界地図をリストに掲載するのは、量が多いためリストにするには無理がありますので、星座データと同じようにGitHubにあげておきます。世界地図のデータは全部で6個のファイルに分けてありますので、ダウンロードして使用してください。
世界地図を描く
世界地図データファイルを読み込んで世界地図を描いてみましょう。ダウンロードしたデータファイルは、プログラムと同じディレクトリにmapというフォルダを作成し、その中に配置してください。
メインルーチン map_display.py
# 入力したデータの星座確認
from PIL import Image, ImageDraw, ImageFont
import tkinter as tk
import csv
import glob


def drawing_frame(map_color, fonts, draw):
    latitude = [
        [16, '+75'],
        [80, '+60'],
        [128, '+40'],
        [160, '+20'],
        [192, '0'],
        [224, '-20'],
        [256, '-40'],
        [304, '-60'],
        [368, '-75']
    ]

    # フレーム
    draw.rectangle((28, 0, 610, 384), outline=map_color, width=1)

    # 緯度
    for i in range(9):
        y = latitude[i][0]
        la = latitude[i][1]
        drawing_latitude(y, la, draw)

    # 経度
    for lg in range(74, 610, 48):
        draw.line((lg, 0, lg, 5), fill=map_color, width=1)
        draw.line((lg, 379, lg, 384), fill=map_color, width=1)
    draw.text((71, 362), '0', font=fonts, fill=map_color)
    draw.text((162, 362), '60', font=fonts, fill=map_color)
    draw.text((256, 362), '120', font=fonts, fill=map_color)
    draw.text((352, 362), '180', font=fonts, fill=map_color)
    draw.text((496, 362), '300', font=fonts, fill=map_color)
    draw.text((584, 362), '330', font=fonts, fill=map_color)


# 緯度を描く
def drawing_latitude(y, la, draw):
    draw.line((28, y, 33, y), fill=map_color, width=1)
    draw.line((605, y, 610, y), fill=map_color, width=1)
    if la == '0':
        draw.text((9, y - 9), la, font=fonts, fill=map_color)
        draw.text((622, y - 9), la, font=fonts, fill=map_color)
    else:
        draw.text((2, y - 9), la, font=fonts, fill=map_color)
        draw.text((614, y - 9), la, font=fonts, fill=map_color)


# 世界地図を描く
def drawing_map(map_color, draw):
    # 地図データの読み込み
    files = glob.glob('./map/*.csv')

    for file_name in files:
        fp = open(file_name, 'r')
        reader = csv.reader(fp)

        for data in reader:
            x = int(data[0]) * 4
            y = int(data[1]) * 4 + 18

            draw.rectangle((x - 2, y - 2, x + 2, y + 2), fill=map_color)

        fp.close()


root = tk.Tk()
root.resizable(False, False)
root.geometry('644x404')
root.title('マイコン宇宙講座 - 世界地図')

img = Image.new('RGB', (642, 402), (0, 0, 0))
draw = ImageDraw.Draw(img)

canvas = tk.Canvas(root, width=642, height=402, bg='black')
canvas.pack(anchor=tk.NW)

# フォント名は実行環境に合わせて変更すること
# TrueTypeの等幅フォント名を指定する
fonts = ImageFont.truetype('Ubuntu-L.ttf', 14)

# カラーパレット
map_color = (80, 160, 0)

# フレーム描画
drawing_frame(map_color, fonts, draw)

# 地図プロット
drawing_map(map_color, draw)

# 描画した星座の画像を保存
img.save('./images/map.png')

# 地図表示
photo = tk.PhotoImage(file='./images/map.png')
canvas.create_image(1, 1, image=photo, anchor=tk.NW)

root.mainloop()
実行すると世界地図が表示されます。

次は大圏コースを描いてみましょう。
サブルーチン geocentric_latitude
# 地心緯度
def geocentric_latitude(r1, r2):
    return math.atan((0.9933055 + 1.1e-9 * r2) * math.tan(r1))
サブルーチン geocentric_distance
# 地心距離
def geocentric_distance(r1):
    return 6378.16 * (0.99832707 + 1.67644e-3 * math.cos(2.0 * r1) - 3.52e-6 * math.cos(4.0 * r1))
サブルーチン geography_latitude
# 地理緯度
def geography_latitude(r1):
    r1 = math.atan(math.tan(r1) / 0.9933055)
    r2 = geocentric_distance(r1)

    return r2
メインルーチン m43.py
# my43.py
# マイコン宇宙講座
# 4-2 大圏コースプログラム
from PIL import Image, ImageDraw, ImageFont
import tkinter as tk
import csv
import glob
import math
import lib
def drawing_frame(map_color, fonts, draw):
latitude = [
[16, '+75'],
[80, '+60'],
[128, '+40'],
[160, '+20'],
[192, '0'],
[224, '-20'],
[256, '-40'],
[304, '-60'],
[368, '-75']
]
# フレーム
draw.rectangle((28, 0, 610, 384), outline=map_color, width=1)
# 緯度
for i in range(9):
y = latitude[i][0]
la = latitude[i][1]
drawing_latitude(y, la, fonts, draw)
# 経度
for lg in range(74, 610, 48):
draw.line((lg, 0, lg, 5), fill=map_color, width=1)
draw.line((lg, 379, lg, 384), fill=map_color, width=1)
draw.text((71, 362), '0', font=fonts, fill=map_color)
draw.text((162, 362), '60', font=fonts, fill=map_color)
draw.text((256, 362), '120', font=fonts, fill=map_color)
draw.text((352, 362), '180', font=fonts, fill=map_color)
draw.text((496, 362), '300', font=fonts, fill=map_color)
draw.text((584, 362), '330', font=fonts, fill=map_color)
# 緯度を描く
def drawing_latitude(y, la, fonts, draw):
draw.line((28, y, 33, y), fill=map_color, width=1)
draw.line((605, y, 610, y), fill=map_color, width=1)
if la == '0':
draw.text((11, y - 7), la, font=fonts, fill=map_color)
draw.text((622, y - 7), la, font=fonts, fill=map_color)
else:
draw.text((5, y - 7), la, font=fonts, fill=map_color)
draw.text((614, y - 7), la, font=fonts, fill=map_color)
# 世界地図を描く
def drawing_map(map_color, draw):
# 地図データの読み込み
files = glob.glob('./map/*.csv')
for file_name in files:
fp = open(file_name, 'r')
reader = csv.reader(fp)
for data in reader:
x = int(data[0]) * 4
y = int(data[1]) * 4 + 18
draw.rectangle((x - 2, y - 2, x + 2, y + 2), fill=map_color)
fp.close()
# 大圏コースプロット
def plotting_course(ob, lg, la, pa, de, ds, ie, K, fonts, draw):
for i in range(1, 3):
lm = lg[i]
fi = la[i]
x = 6 + K[3] * (lm + 0.523599) * 0.4
if x > 150:
x = x - 150 + 6
fo = abs(fi)
y = 21.7007 * math.log(math.tan(math.pi / 4.0 + fo / 2.0))
if fi > 0:
y = -y
if fi * K[3] > 73:
y = -44
if fi * K[3] < -73:
y = 44
x = int(x / 2)
y = int(12.5 + y / 4)
if x < 40:
draw.text((x * 8, (y + 1) * 16), ob[i], font=fonts)
if x >= 40:
draw.text(((x - 7) * 8, (y + 1) * 16), ob[i], font=fonts)
draw.ellipse((x * 8, y * 16, x * 8 + 10, y * 16 + 10))
draw.ellipse((x * 8 + 2, y * 16 + 2, x * 8 + 8, y * 16 + 8), fill=(255, 255, 255))
# draw.text((x * 8, y * 16), '*', font=fonts)
# 大円のプロット
if pa > math.pi and lg[2] > math.pi:
lg[2] = lg[2] - (2.0 * math.pi)
ii = int(abs((lg[1] - lg[2]) / (15.0 / K[3])))
iv = 15.0 / K[3]
sg = 1
if pa > math.pi:
sg = -1
lm = lg[1] + iv * sg
for i in range(ii):
fi = math.atan(math.tan(ie) * math.sin(lm - de))
x = 6 + K[3] * (lm + 0.523599) * 0.4
fo = abs(fi)
y = 21.7007 * math.log(math.tan(math.pi / 4.0 + fo / 2.0))
if fi > 0:
y = -y
if fi * K[3] > 73:
y = -44
if fi * K[3] < -73:
y = 44
x = int(x / 2)
y = int(12.5 + y / 4)
draw.text((x * 8, y * 16), '*', font=fonts)
lm += iv * sg
# メイン
obs = [0, 0, 0]
lg = [0, 0, 0]
la = [0, 0, 0]
# 起点都市と終点都市の情報を入力
while 1:
obs[1] = input('\n起点都市の名前 ? ')
lg[1] = float(input('その経度 ? '))
la[1] = float(input('その緯度 ? '))
lg[1] /= lib.K[3]
la[1] /= lib.K[3]
if lg[1] < 0:
lg[1] += 2.0 * math.pi
obs[2] = input('\n距離を求めたい都市の名前 ? ')
lg[2] = float(input('その経度 ? '))
la[2] = float(input('その緯度 ? '))
lg[2] /= lib.K[3]
la[2] /= lib.K[3]
if lg[2] < 0:
lg[2] += 2.0 * math.pi
check_lg1 = abs(lg[1] - lg[2]) < 1.0e-4
check_lg2 = abs(lg[2] - lg[1] - math.pi) < 1.0e-4
if check_lg1 and check_lg2:
print('\nERROR: この大円は計算できません!\n')
continue
else:
break
# 2都市間の距離と位置角の計算
ss = math.cos(la[2]) * math.sin(lg[2] - lg[1])
cc = math.cos(la[1]) * math.sin(la[2]) - math.sin(la[1]) * math.cos(la[2]) * math.cos(lg[2] - lg[1])
tt = lib.quadrant(ss, cc)
pa = tt
cc = math.sin(la[1]) * math.sin(la[2]) + math.cos(la[1]) * math.cos(la[2]) * math.cos(lg[2] - lg[1])
ss = ss / math.sin(pa)
tt = lib.quadrant(ss, cc)
dg = tt * lib.K[3]
ds = 111.195 * dg
ss = math.tan(la[1])
cc = (math.tan(la[2]) - math.tan(la[1]) * math.cos(lg[2] - lg[1])) / math.sin(lg[2] - lg[1])
tt = lib.quadrant(ss, cc)
de = lg[1] - tt
ss /= math.sin(lg[1] - de)
ie = math.atan(ss)
print('\n')
print(obs[1], ' から ', obs[2], ' までの距離')
print(' 距離 = %8.2f Km' % (ds))
print(' 位置角 = %8.2f' % (pa * lib.K[3]))
print('\n')
std = input('PRESS ANY KEY ')
# ウィンドウとキャンパス
root = tk.Tk()
root.resizable(False, False)
root.geometry('644x404')
root.title('マイコン宇宙講座 - 大圏コース・プログラム')
img = Image.new('RGB', (642, 402), (0, 0, 0))
draw = ImageDraw.Draw(img)
canvas = tk.Canvas(root, width=642, height=402, bg='black')
canvas.pack(anchor=tk.NW)
# フォント名は実行環境に合わせて変更すること
fonts1 = ImageFont.truetype('TakaoPGothic.ttf', 13)
fonts2 = ImageFont.truetype('TakaoPGothic.ttf', 20)
# カラーパレット
map_color = (80, 160, 0)
# フレーム描画
drawing_frame(map_color, fonts1, draw)
# 地図プロット
drawing_map(map_color, draw)
# 大圏コースプロット
plotting_course(obs, lg, la, pa, de, ds, ie, lib.K, fonts2, draw)
result = 'From ' + obs[1] + ' to ' + obs[2] + ' Distance = %7.2f Km Position Angle = %5.2f' % (ds, pa * lib.K[3])
draw.text((70, 340), result, fill=map_color, font=fonts1)
# 描画した星座の画像を保存
img.save('./images/map.png')
# 地図表示
photo = tk.PhotoImage(file='./images/map.png')
canvas.create_image(1, 1, image=photo, anchor=tk.NW)
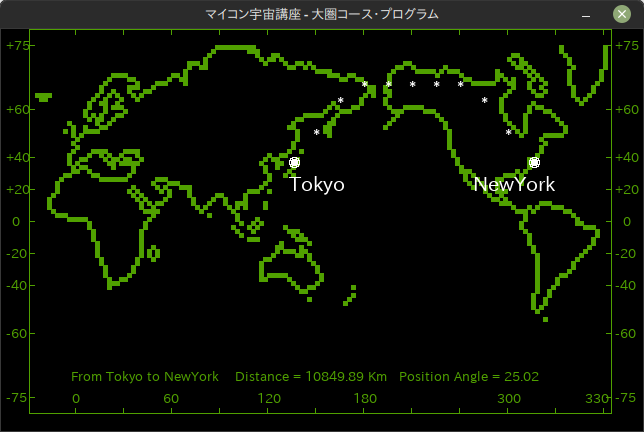
root.mainloop()例題 東京とニューヨークの2点間の位置角と距離を求め、そのコースを表示してみよう。
起点都市の名前 ? Tokyo
その経度 ? 139.745
その緯度 ? 35.654

距離を求めたい都市の名前 ? NewYork
その経度 ? -73.87
その緯度 ? 40.77


Tokyo  から  NewYork  までの距離
     距離  = 10849.89 Km
     位置角 =    25.02


PRESS ANY KEY